
Benchmark
Key takeaways
OVERALL
| # | Source | Type | Citations | Share |
|---|---|---|---|---|
| 1 | Community | 770 | 18% | |
| 2 | Boots | Retailer | 514 | 12% |
| 3 | NHS | Health authority | 471 | 11% |
| 4 | YouTube | Video | 385 | 9% |
| 5 | DermNet | Medical / education | 300 | 7% |
01
| # | Source | Type | Citations | Share |
|---|---|---|---|---|
| 1 | Community | 182 | 22% | |
| 2 | YouTube | Video | 141 | 17% |
| 3 | Boots | Retailer | 96 | 12% |
| 4 | Glamour | Editorial | 74 | 9% |
| 5 | Marie Claire | Editorial | 63 | 8% |
02
| # | Source | Type | Citations | Share |
|---|---|---|---|---|
| 1 | Boots | Retailer | 156 | 19% |
| 2 | Community | 139 | 17% | |
| 3 | Lookfantastic | Retailer | 104 | 13% |
| 4 | Cosmopolitan | Editorial | 81 | 10% |
| 5 | YouTube | Video | 67 | 8% |
03
| # | Source | Type | Citations | Share |
|---|---|---|---|---|
| 1 | NHS | Health authority | 163 | 21% |
| 2 | DermNet | Medical / education | 129 | 17% |
| 3 | Community | 111 | 14% | |
| 4 | British Association of Dermatologists | Medical authority | 86 | 11% |
| 5 | Boots | Retailer | 62 | 8% |
04
| # | Source | Type | Citations | Share |
|---|---|---|---|---|
| 1 | Community | 151 | 20% | |
| 2 | YouTube | Video | 117 | 15% |
| 3 | Boots | Retailer | 98 | 13% |
| 4 | Trustpilot | Reviews | 76 | 10% |
| 5 | Glamour | Editorial | 61 | 8% |
05
| # | Source | Type | Citations | Share |
|---|---|---|---|---|
| 1 | Trustpilot | Reviews | 142 | 19% |
| 2 | Community | 128 | 17% | |
| 3 | YouTube | Video | 94 | 13% |
| 4 | Boots | Retailer | 83 | 11% |
| 5 | Reddit r/SkincareAddiction | Community | 68 | 9% |
06
| # | Source | Type | Citations | Share |
|---|---|---|---|---|
| 1 | Boots | Retailer | 174 | 24% |
| 2 | Lookfantastic | Retailer | 132 | 18% |
| 3 | Amazon UK | Marketplace | 94 | 13% |
| 4 | Cult Beauty | Retailer | 78 | 11% |
| 5 | Space NK | Retailer | 56 | 8% |
OVERALL
| # | Brand | Citations | Share of stage |
|---|---|---|---|
| 1 | CeraVe | 788 | 18.4% |
| 2 | La Roche-Posay | 518 | 12.1% |
| 3 | The Ordinary | 454 | 10.6% |
| 4 | Nivea | 398 | 9.3% |
| 5 | Clinique | 325 | 7.6% |
01
| # | Brand | Citations | Share of stage |
|---|---|---|---|
| 1 | CeraVe | 184 | 20.8% |
| 2 | The Ordinary | 142 | 16.1% |
| 3 | La Roche-Posay | 113 | 12.8% |
| 4 | Nivea | 92 | 10.4% |
| 5 | Neutrogena | 71 | 8.0% |
02
| # | Brand | Citations | Share of stage |
|---|---|---|---|
| 1 | CeraVe | 171 | 19.2% |
| 2 | La Roche-Posay | 146 | 16.4% |
| 3 | The Ordinary | 109 | 12.2% |
| 4 | Clinique | 84 | 9.4% |
| 5 | Eucerin | 69 | 7.7% |
03
| # | Brand | Citations | Share of stage |
|---|---|---|---|
| 1 | La Roche-Posay | 163 | 19.8% |
| 2 | CeraVe | 148 | 18.0% |
| 3 | Eucerin | 112 | 13.6% |
| 4 | The Ordinary | 87 | 10.6% |
| 5 | Neutrogena | 64 | 7.8% |
04
| # | Brand | Citations | Share of stage |
|---|---|---|---|
| 1 | CeraVe | 156 | 18.9% |
| 2 | La Roche-Posay | 151 | 18.3% |
| 3 | The Ordinary | 105 | 12.7% |
| 4 | Clinique | 83 | 10.0% |
| 5 | Nivea | 67 | 8.1% |
05
| # | Brand | Citations | Share of stage |
|---|---|---|---|
| 1 | La Roche-Posay | 143 | 18.1% |
| 2 | CeraVe | 136 | 17.2% |
| 3 | Clinique | 98 | 12.4% |
| 4 | The Ordinary | 81 | 10.3% |
| 5 | Eucerin | 62 | 7.9% |
06
| # | Brand | Citations | Share of stage |
|---|---|---|---|
| 1 | CeraVe | 149 | 21.3% |
| 2 | La Roche-Posay | 127 | 18.1% |
| 3 | Nivea | 91 | 13.0% |
| 4 | Clinique | 76 | 10.8% |
| 5 | The Ordinary | 61 | 8.7% |
“What are the best skincare brands in the UK?”
“Which skincare brands are best for sensitive skin?”
“What is the best moisturiser for dry, sensitive skin?”
“Is CeraVe or La Roche-Posay better for acne-prone skin?”
“Is CeraVe actually recommended by dermatologists?”
“Where is the best place to buy La Roche-Posay in the UK?”
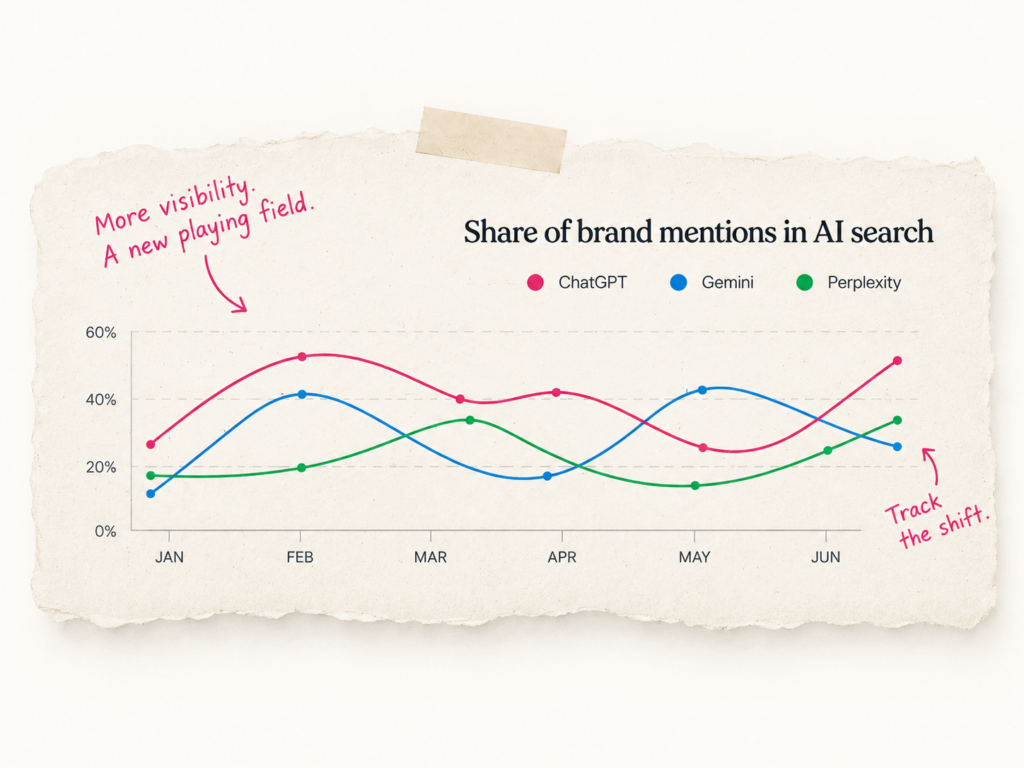
We analysed 250 representative search queries across seven stages of the skincare customer journey.
Each query was tested across ChatGPT, Gemini, Perplexity and Google AI Overviews. Responses were collected, cited domains were extracted, and brand mentions were classified by query stage.
Weighted share of voice was calculated using both frequency of appearance and position within each response.
Get the complete dataset, methodology and breakdown of results.
Want the numbers?
Get access to the underlying data, methodology and additional charts behind our benchmark studies.
New datasets, trend updates and AI search benchmarks as we publish them.